All numbers are not created equally, and it is important to understand the type of measurement system data values fall into. Typically, data is organized into one of four measurement systems: nominal, ordinal, interval, and ratio.
Nominal values distinguish one occurrence from another. Each value in this system represents something unique where there is no relationship between numbers. For example, a land use value of 4 – agricultural land – is not half the land use of 8, which is coniferous forest. Land use categories, zip codes, and telephone numbers are examples of nominal values.
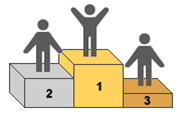
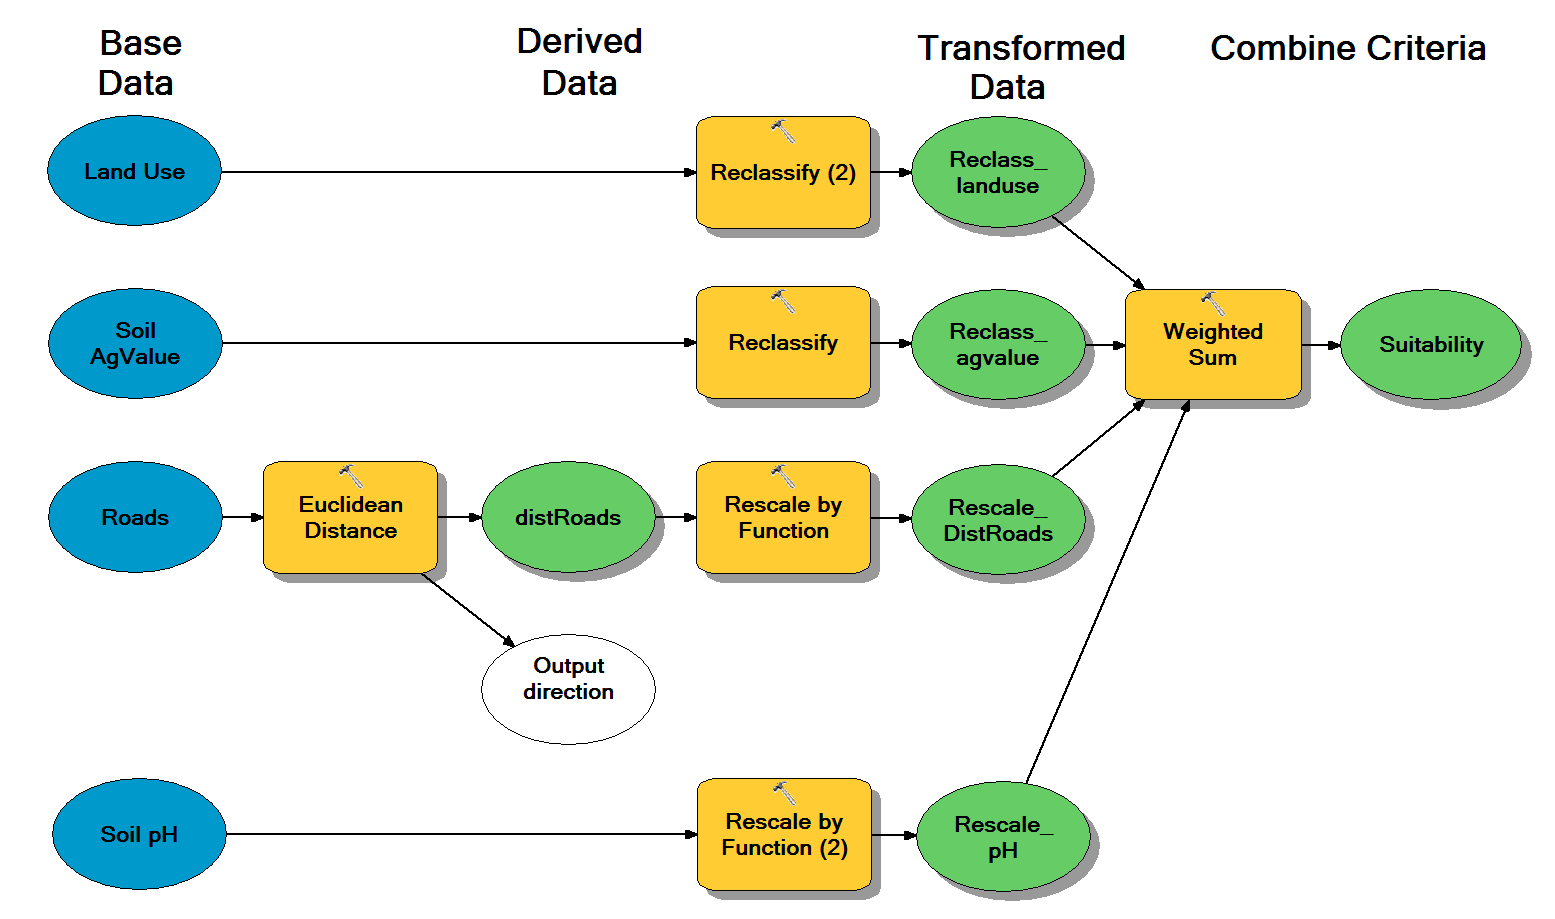
Ordinal values describe placement or position, such as athletes on a podium. However, ordinal values cannot answer “how much more” or other questions regarding magnitude. A person who achieves the highest score on a test did not necessarily do twice as well as the person who received the 2nd highest score. Rankings, such as the agricultural value of soil is a good example of ordinal values.
Facebook
Share