To analyze what locations the firefighters can reach and how fast they can reach them, the surface they are moving across must be defined. This surface is a cost surface.
In our case, in the cost surface, every location (or cell) identifies how long it will take the firefighters to travel through it based on the characteristics of the location, for example, the slope and land-use type.
You can create the cost surface the same way you create a suitability model; first, the factors and criteria influencing the movement of the firefighters is identified. Like with the suitability model, each criteria value is put on a common preference scale, in this case based on the difficulty of movement. We will use a 1 to 10 scale. Unlike the suitability model where the higher the value the greater the preference, in a cost model, the lower values are less costly therefore they are more preferred since they are easier to travel through.
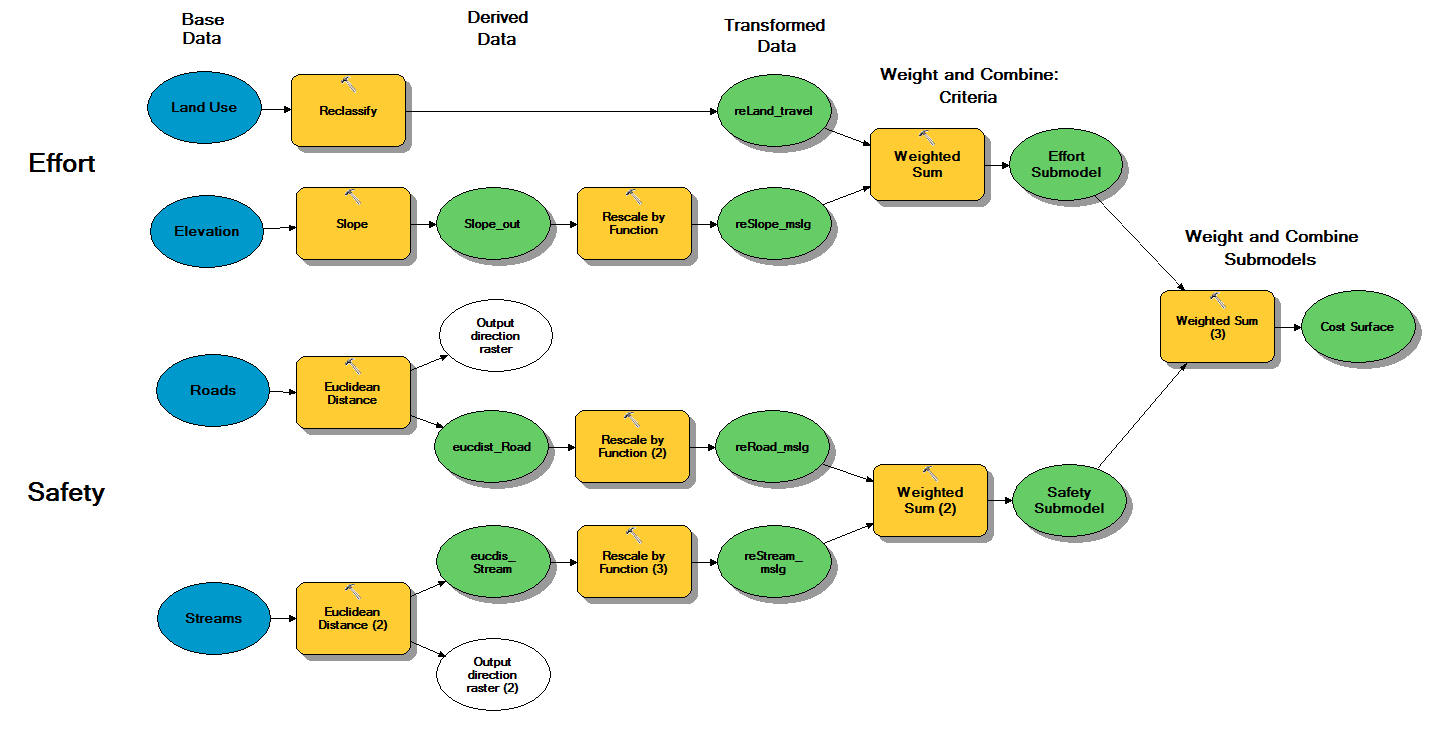
In this cost model there are two factors influencing movement; effort and safety. Each factor is represented by a submodel. Land use and slope are the two criteria affecting effort and distance from roads and distance from streams are the criteria affecting safety. Examine the cost model:
Explore the cost surface which is displayed in the Map. The lower the values (the brighter the green) are locations that are easier to travel through. Examine the input criteria by clicking around on the surface and clicking through the popups.
Understand the model base criteria as well as how these criteria are transformed onto the 1 to 10 movement preference scale:
Land Use
.....Original map
.....Transformed (1 to 10 scale - based on category)
Slope
.....Original map
.....Transformed (1 to 10 - lower slopes far more costly)
Distance from Roads
.....Original map
.....Transformed (1 to 10 scale - closer distances far more safe)
Distance from Streams
.....Original map
.....Transformed (1 to 10 scale - closer distances far more safe)
Facebook
Share