by Kevin M. Johnston Ph.D. Esri
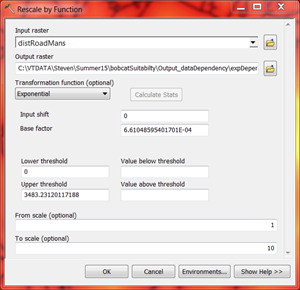
The concept of data dependency exists within the Reclassify and Rescale by Function tools, two tools commonly used to transform data in suitability models. Data is transformed to model a phenomenon’s preference to criteria. When the values in a study area are input into these tools, the minimum and maximum values are found. The phenomenon’s preference is then “fit” to these values by default.
For example: A phenomenon, in this case wild bobcat, exponentially prefer distances farther away from roads. Within our study area, the minimum distance from roads (0 meters) is assigned the lowest preference of 1 (on a preference scale of 1 to 10) and the maximum distance from roads (about 3500 meters) is assigned the highest preference value of 10. Essentially these minimum and maximum data values are, by default, defined as the lower and upper thresholds of the phenomenon’s preference scale.
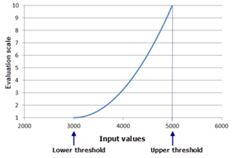
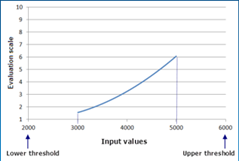
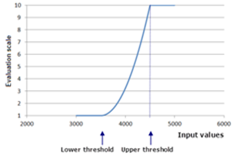
Most suitability models map the minimum and maximum values of its criteria to the minimum and maximum of the preference scale – this is the outcome of using the tool defaults within the model. This data dependent form of modeling results in three unintentional consequences. Consider, what would happen if the minimum and maximum values were to change?