Skip to content
Loading…
This layer is editable and shared with the public. To prevent unwanted editing, unshare this item or approve it for public data collection.
Finish setting up your layer
Describe your item below. Add fields on the Data tab. Configure editing on the Settings tab. Configure drawing and pop-ups through Map Viewer or Visualization tab.

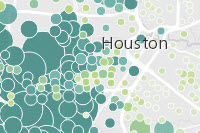
This map displays household net worth and average income using both size and color. A brief summary of the item is not available. Add a brief summary about the item.

‎Web Map by

New notebook runtime available. You can update the runtime from the settings tab of the item details page.

Item created: Nov 12, 2015 Item updated: Nov 4, 2016 View count: 7,835

Snapshot last refreshed:

1965 characters left.

Description

This map uses smart mapping to show a comparison of Net Worth and Average Household Income in Houston, Texas. 

Color represents the Average Household Income, while the size of the circles shows the Average Net Worth. Using this bi-variate method allows comparison of two variables at one time. The darkest colors of green show the most wealthy areas, and the light green with lower average income. The largest circles show the highest net worth while the smallest circles show the lowest net worth. This visual representation allows for a deeper understanding of how the wealth in Houston is being distributed.

The data was created using Esri's ArcGIS Online data enrichment using the Block Group Areas Living Atlas Analysis layer. The vintage of the data is 2015. 

An in-depth description of the item is not available.

Ground Layers

Tools

Tables

Project Contents:

Solution Contents

Contents

Layers

Screenshots

Terms of Use

This work is licensed under the Web Services and API Terms of Use.   
                        View Summary  |  View Terms of Use

No special restrictions or limitations on using the item's content have been provided.

Comments (0)

Sign in to add a comment.
Item Information

LowHigh

Item Information

LowHigh

Make your item easy to find, understand, and use by providing this information.

    Details

    Dashboard views: Desktop

    Creating data in:

    Published as:

      Other Views:

        Dependent items in the recycle bin

          Applicable: 2d

          Size: 1.22 KB

          Attachments size: 0 KB

          ID: 086802b8c31247a7ae958ad474acdc5d

          Image Count: 0

          Image Properties

          Layer Drawing

          Using tiles from a cache

          Dynamically from data

          Share
          Owner

          lisa_berry

          Folder

          Categories

          This item has not been categorized.

          Assign Category
          Edit Tags
          Credits (Attribution)
          No acknowledgements.

          Esri

          URL View
          WMTS View
          Your tile layer is ready to use
          This tile layer will automatically create tiles as needed and cache them for future use. No further configuration is required. View the Settings tab to change the default options. Build tiles manually for specific scales and extents to improve display performance for the first person to view the tile layer at that scale and extent. Tiles must exist if the layer will be used offline.
          All items were exported successfully
          ${numberOfItems} item(s) were exported successfully. Some item(s) skipped or failed to export.
          See description for more information
          Cannot import
          Export packages from newer portal versions cannot be imported to older versions.
          Loading…